Flora y Fauna del estanque de Rovacias, Comillas, Cantabria 2020

En un intento de poner mi granito de arena al esfuerzo que hace la sociedad cántabra por mantener la biodiversidad de su región, he compilado una lista de mis “vecinos”  😉 todos aquellos que tienen la “suerte”  de no formar parte del género de primates homínidos homo sapiens.

Este año, he aprovechado la paz y tranquilidad de la que hemos disfrutado en Comillas en los últimos meses. Armada con mi modesta cámara, he estado haciendo un seguimiento de las especies que habitan en el parque del pueblo que colinda con mi vivienda. Esta página es un pequeño resumen de lo que pude ver.

Siendo una modesta fotógrafa aficionada, aunque me he esforzado por suministrar fotos que hagan justicia a sus protagonistas, en algunos casos he tenido que utilizar otras fuentes que han hecho una mejor labor. Los autores de las fotografias que no son mías están claramente identificados debajo de la imagen. Además están claramente marcadas con el símbolo (*). Al seleccionar la imagen, puedes acceder a una página que suministra más información de la especie identificada.

No conociendo a fondo los nombres de la flora y fauna regionales, he tenido que tirar de distintas fuentes, además de Wikepedia. Las más útiles han sido:

  1. Duran, J. A. (2014). Catálogo de la flora vascular de Cantabria. Jolube Consultor y Editor Botánico.
  2. Gómez, J. E. & Calle, M. S. (2020). LEPIDÓPTEROS DE LA PENÍNSULA IBÉRICA Y EL SUR DE EUROPA. Alfabético por nombres científicos y familias. Datos, fotos, fichas, vídeo.
  3. Pereira Martínez, J.M. (2017). Guía de insectos del Anillo Verde de la Bahía de Santander. Fundación Naturaleza y Hombre.
  4. Red Camberra (2019). Guía básica de los anfibios en Cantabria.
  5. Discover Life (2020). herramientas gratuitas en línea para identificar especies, enseñar y estudiar las maravillas de la naturaleza, informar hallazgos, construir mapas, procesar imágenes y contribuir y aprender de la naturaleza. Una creciente e interactiva enciclopedia de vida con 1,418,663 páginas de especies y 819,760 mapas.

correhuela

Reflexiones, II Edición del ExpoForum Más Allá del CV

.Entre el 7 y el 9 del mes pasado, 12 de las 15 Lanzaderas de Cantabria se reunieron en la “II Edición del ExpoForum Más Allá del CV”. El evento cuenta con la aprobación del Ayuntamiento de Santander ya que, como afirmó la alcaldesa Gema Igual Ortiz, está consolidado y es orgullo de todos los santanderinos. Por otra parte, ofrece la oportunidad a los participantes de poner en valor su marca personal.

Objetivo y alcance del Expo Forum

Forma parte de un programa pionero en España, La Lanzadera de Empleo y Emprendimiento Solidario, que nació en el 2012, como una de las medidas diseñadas por el Servicio Cántabro de Empleo. “Constituyen un planteamiento totalmente innovador” señaló José Manuel Callejo Calderón, Director General del EMCAN. Un programa común (parte integral de la política de empleo nacional) que ha funcionando efectivamente. Es una herramienta clave de la sociedad para superar el impacto ocasionado por los años de crisis.

Fué concebido por Deva Carmona quien, junto con los demás participantes del programa en el 2018, consideraron el CV herramienta insuficiente para la búsqueda de empleo. El siglo XXI, era de la creatividad y la innovación, exige un cambio de perspectiva. En consecuencia, crean un espacio que permita reflexionar acerca del mercado laboral.

Principales actividades de la Segunda Edición

Profesionales de diferentes empresas y sectores, personas en situación de desempleo, instituciones y universidades, han colaborado fomentando un diálogo, que ha incluido los puntos de vista de todos. En su primera edición contaron con la presencia de 44 paneles. La segunda ha contado con 70. Ha habido un mayor escaparate y más empresas. El foro ha ofrecido un panorama muy amplio del ámbito laboral. Además de la exposición de los paneles diseñados por los miembros de las distintas Lanzaderas cántabras, han contribuido varias empresas, regionales y de fuera, con las que se ha creado un ambiente de debate, intercambio y análisis del entorno laboral.

Expo Forum 2019 paneles

Se ofreció apoyo y recursos a los participantes para concebir su marca personal a través de los paneles que estuvieron en exhibición en la sala principal durante los 3 días del evento. También se programaron sesiones #CISETraining durante las cuales los participantes anunciaron la marca personal desarrollada. Por otra parte, las empresas tuvieron la oportunidad de explorar los retos a los que todas ellas se enfrentan a la hora de identificar y captar el talento que necesitan para superar los retos que enfrentan actualmente.

Se trataron 4 temas principalmente. En primer lugar, los ejes estratégicos de los RRHH en la empresa y lo que la gente en búsqueda activa de empleo debe tener presente. La formación y su importancia para ampliar el abanico de oportunidades en el ámbito laboral. La RSC en las empresas y el impacto de la revolución digital tanto para las empresas como para las personas en búsqueda activa de empleo.

Carmen Sarabia Cobo, destacó la importancia de la salud en el período de búsqueda activa de empleo. Identificó el estrés y la falta de ilusión, como dos de los factores que más afectan la salud de las personas durante este período. Además de educar y animar a la audiencia con una ponencia muy instructiva, entre la serie de refranes y pensamientos que nos ofreció, procuraré tener siempre presente el siguiente:

“usa tu cerebro, millones de años de evolución no fueron para ponértelo de adorno”

Los datos del paro son positivos (3620 menos desempleados que en este periodo del año pasado). Hay una reducción del 22% en el paro pero todavía quedan cosas por resolver. Es necesario ayudar a las personas a desarrollar y promocionar sus competencias y talentos. Maximizar los beneficios derivados de la revolución digital. Dar mejores oportunidades al talento femenino y promover la igualdad inter-generacional.

En definitiva, actualmente las empresas, a la hora de contratar evalúan (además del conocimiento)

  • La capacidad de adaptación de la gente.
  • Las habilidades humanas y sociales.
  • La motivación y la ilusión.
  • En la era de la información es difícil adaptarse, por tanto la capacidad de adaptación frente a la creciente velocidad de cambio es fundamental.
  • La actitud con “C” son los ejes que demanda la industria.
  • El compromiso, la lealtad, la honestidad, la humanidad y la profesionalidad.

Frente a estas expectativas, las personas en búsqueda activa de empleo, deben tener presente que,

  • No existe una forma única de evaluación, las empresas cuentan con procesos de selección masivos: Facebook, instagram y demás redes sociales ayudan a las empresas de RRHH a evaluar los candidatos. Por lo tanto, cuida y cultiva tu presencia digital.
  • Las vacantes en las grandes empresas se suelen anunciar primero de manera interna.
  • Las cartas de motivación suelen ser más importantes que los CV. Se debe cuidar el síndrome de “copy, paste”.
  • La flexibilidad de jornada está siendo más adoptada en las grandes empresas. También la reducción de la jornada laboral.
  • La desigualdad de género todavía es evidente en la tasa de desempleo en Cantabria (11.3% hombres, 13% mujeres). Sin embargo, las oportunidades para el talento femenino han aumentado y corre por cuenta nuestra pillarlas y explotarlas.
  • El sistema de acreditación de competencias es importante.
  • Cursos masivos a distancia está creciendo (MOOC: Massive Open Online Courses) y constituyen una herramienta útil para la formación.
  • La sub-contratación está en aumento y es una salida a tomar en cuenta.
  • Hoy en día hay más tendencia en las empresas a apostar por los mayores, mejorando la igualdad inter-generacional.

Para los “emprendedores”

Aquellas personas que contemplan montar su propio negocio deben tener presente que el “Emprendimiento” es complicado. Requiere mucho trabajo y alto grado de adaptación al cambio, no importa el control horario, lo esencial es el compromiso. Las personas deben estar realmente implicadas con los objetivos que quiere alcanzar la empresa de la que forman parte. Actualmente, la puesta en marcha de un modelo de negocio itinerante constituye una alternativa viable para resolver las necesidades de los pueblos vacios en España.

Los pasos que se deben seguir para asegurar la anhelada entrevista, no quedaron claros. Lo importante es recordar que hoy, por ley, no está permitido recoger CV en mano. La cantidad de recomendaciones recopiladas durante la jornada, permiten confirmar que ha sido fructífera y útil para todos los asistentes.

Open Data, Circular Economy and the Spanish energy sector in 2017

Sustainable supply chain management practices have recently been developed. The aim is to integrate environmental concerns into organizations and reduce unintended negative environmental consequences triggered by production and consumption processes. In parallel, the Circular Economy (CE) pushes the frontiers of environmental sustainability. It emphasizes the idea of transforming products, enabling workable relationships between ecological systems and economic growth. In this context, to guarantee success, the exchange of information across the supply chain is essential. Evaluating the renewable energy industry in Spain clarifies the extent to which its underlying information framework enables the sustainability of energy production in the country.

Open Data (OD) indicators, provide the means to assess its maturity on openness and information availability, key requirements of a successful CE for sustainable flow identification across the energy supply chain. Furthermore, the OD Initiative  ensures correct management of information as society transitions to this new economic framework. To guarantee success, the EU conducts periodic evaluations on the level of improvement of Open Data Maturity in each of the EU28 countries, including Norway, Switzerland and Liechtenstein. The results for 2016 show the Spanish OD portal is one of the most mature.

In order to determine the real extent, that the Spanish RE sector is contributing to this effort, an attempt was made to answer different questions, discussed below, using the portal’s data.

Is the Spanish Bio-energy sector making a significant contribution to the CE efforts in Spain?

The datasets currently available in the portal do not provide the means to generate a satisfactory answer. Nevertheless, searching for information in other public data sources, such as: published research results, Spanish organizations associated to the sector but which have not yet contributed datasets to the OD portal, it was possible to generate a response.

Figure 1. Distribution of Energy sources in SPAIN – 2015. Data Source

Transport, Heating/cooling and Electricity

The 3 main forms of energy consumption in Spain and the Bio-energy sector can contribute to all of them, thereby enabling multiple opportunities to the sector for acting as a supplier of the different types of clean energy necessary (heat from burning wood, bio-digesters for electricity) to drive the Spanish economy. Having said this, the overall contribution of renewable energy to the overall demand (Figure 1) is rather small.

Figure 2. Distribution of Electricity sources in SPAIN – 2016

The use of bio-digesters have additional benefits such as enabling more effective means of reducing/reusing waste, and the reduction of  emissions/environmental impacts associated to the generation/use of energy. In spite of this, the technology is still not making a significant contribution to the supply of electricity in the country (Figure 2), so it is one area that ought to be explored further, given the significant levels of electricity consumed by the overall Spanish community.

Figure 3. Transport fuel consumption in Spain – distribution according to types. (adapted from Espejo et al., 2016)

In relation to the fuel driving the Spanish transport system, the consumption of bio-fuels reached a peak in 2012 (Figure 3) but since then there is a downward trend that should be revised. Furthermore, more recent data shows the general public is not being helped to make the transition as there are less supply points distributed around the country.

Figure 4. LCA (GWP of 1t UCO re-use, average GWP (Kgs-CO2e)). Adapted from Lombardi et al., 2017

Bio-fuels, for transport and electricity, can be produced setting aside big chunks of land to obtain the oil required. This is problematic in terms of the sustainability goals as it triggers a direct competition for land to satisfy both, the supply of food and energy. This means, it is necessary to search for alternative sources, for example the reuse of used cooking oil (UCO), after all Spain is one of the highest consumers of vegetable oil in Europe (together with Greece and Italy). It is worth mentioning the research results recently published by Lombardi et al. (2017), which show the recovery of UCO in a cogeneration plant has in general lower values in terms of environmental impacts than its employment in biodiesel production (Figure 4). When products and co-products substitution are included, the savings obtained by the substitution of conventional diesel production, in the biodiesel cases, are significantly higher than the avoided effects for electricity and heat in the cogeneration case. In particular, using UCO in the biodiesel production processes, the savings vary from 41.6 to 54.6 GJex/tUCO, together with an estimated savings of 2860 kg CO2eq per tUCO in emissions.

Conclusions

The experience of using the OD portal to assess the contribution of the bio-energy sector to the sustainability of the Spanish economy in the country has shown its data maturity regarding this type of data is not quite as high as the results of the EU portal seem to suggest.
The availability of data associated to the Energy sector, in particular the bio-energy sector, is rather poor, but we cannot hold the group in charge of the portal responsible, as its improvement in all aspects (quality, quantity, usefulness) is a responsibility of all. As far as the contribution of the bio-energy sector goes: there is a lot of work to do.
Reviewing alternative data sources have demonstrated the use of bio-energy to support Electricity generation and for Transport has a lot of potential in Spain as the sector can help the transition to a CE in different ways, although many of the paths still require significant improvement and development.
Regarding the population of the portal, the various organisms (both public and private) ought to start making explicit contributions.
They ought to put pressure on the government in helping society increase the use of bio-energy, after all recent research results seem to suggest, the use of this energy source can indeed help to drive the change required to meet the UN SDG and the transition to a C.

References

  1. APORTA (2017). Open Data portal in Spain.
  2. Espejo Marin, et al., 2016. Contribución al estudio del sector de los biocarburantes en España
  3. Instituto para la Diversificación y Ahorro de la Energía, IDAE. (2017)
  4. Lombardi, L., Mendecka, B., & Carnevale, E. 2017. Comparative life cycle assessment of alternative strategies for energy recovery from used cooking oil. Journal of Environmental Management.( http://www.sciencedirect.com/science/article/pii/S0301479717304760)
  5. Open Data in Europe (2017).

Plataforma de Datos Abiertos, sector agricola español, economia circular

Figura 1. Distribución de datos por CA en España disponibles en la plataforma DA

La integración de los esfuerzos realizados por distintas áreas de investigación, a saber: ciencias naturales, ciencias sociales, ingeniería y gestión es esencial para superar los retos ambientales que la sociedad enfrenta actualmente.  La cooperación del ciudadano es también fundamental.

Acordar un fin común exige compartir conocimientos, entender el dónde, el cuándo, el cómo y el por qué. También es necesario estimar el posible impacto de las distintas soluciones diseñadas e implementadas.

La información generada y gestionada por el sector público constituye una fuente primordial de conocimiento. Su reutilización responde a la aceptación de que los datos generados por las Administraciones Públicas (incluyendo centros universitarios y de investigación), que además han sido financiados con el dinero del contribuyente, pueden tener otras aplicaciones. Tanto en el sector privado como en las manos de los ciudadanos y pequeñas empresas asociadas a los distintos sectores de la economía española. Los datos meteorológicos son un ejemplo clásico. Constituyen datos recogidos por satélites que no pueden ser financiados por aquellos que, por ejemplo, ofrecen servicios de previsión meteorológica o desarrollan aplicaciones para gestionar el ambiente o sistemas agrícolas.

La iniciativa Open Data o “Datos Abiertos (DA)”

Fomentar la reutilización de datos responde a un doble objetivo: uno de carácter social y político  al  favorecer la transparencia del sector público,  otro de carácter económico, dado que la información del sector público supone un potencial generador de riqueza. Constituye además una forma directa de promover y garantizar el éxito de la economía circular, una filosofía de organización de sistemas cuya utilidad en la gestión de los GEI derivados del sector agrícola se discute en  (1).

La iniciativa DA es una filosofía y práctica que persigue que los  datos pertenecientes a las Administraciones Públicas sean accesibles y estén disponibles para todo el mundo, sin restricciones técnicas ni legales, debe ser apoyada y promovida por todos los entes, públicos y privados, dado que su finalidad es garantizar que la información pueda ser redistribuida y reutilizada tanto por los ciudadanos como por empresas en beneficio de todos (3).

Analizando el impacto ambiental de  los subsidios de la PAC en Navarra usando la plataforma DA española

A pesar del aparente éxito en España (6), un estudio desarrollado para corroborar su utilidad, ha demostrado que organismos como REMEDIA deben involucrarse más en la iniciativa y garantizar su utilización para beneficio de todos.  El mencionado estudio analiza el impacto (o beneficio) ambiental derivado de  los subsidios otorgados por la PAC en la región de Navarra (5).  En relación con la utilidad de la plataforma de DA gestionada en España (2) para llevar a cabo este análisis, el estudio ha demostrado:

  1. Una enorme diferencia entre las versiones de las plataformas gestionadas por cada una de las comunidades del país.
  2. Existen diferencias significativas en calidad y cantidad de datos en cada CA, y los aportados en el portal DA España (Figura 1).
  3. Importantes diferencias en la temporalidad de los datos.
  4. Muchos de los URI disponibles en la plataforma no funcionan. Esto dificulta el acceso a los mismos.
  5. Baja participación del sector agrícola o ambiental a la iniciativa APORTA.

Conclusión

Existe poca concordancia entre los resultados de la evaluación de DA españoles en 2016 y la realidad. Esto ha quedado demostrado, al estudiar la relación entre PAC y su impacto (o no ambiental). Además, corrobora la necesidad de fomentar lazos entre la iniciativa APORTA y los esfuerzos de organismos como la red REMEDIA. Esto es fundamental, dado el interés por promover la  economía circular. Por otra lado, esto posibilita la evolución hacia una forma de producción sostenible, particularmente en el sector agrícola (4).

Falta de conocimiento, colaboración,  experticia y recursos, son algunas de las razones identificadas en la reciente conferencia internacional de datos abiertos que tuvo lugar en Madrid (IODC16), para subsanar los problemas  asociados a las plataformas que actualmente operan en distintos puntos del mundo. Este  estudio  ha demostrado que estos problemas también afectan a la plataforma  de datos gestionada por el gobierno español.  A pesar de esto, existe interés por subsanarlos y es importante que todos contribuyamos  para asegurar su éxito.

Referencias

  1. Ghisellini, P., Protano, G., Viglia, S., Gaworski, M., Setti, M., & Ulgiati, S. (2014). Integrated agricultural and dairy production within a circular economy framework. A comparison of Italian and Polish farming systems. Journal of Environmental Accounting and Management, 2(4), 367-384.
  2. Iniciativa de datos abiertos del Gobierno de España, 2016.
  3. Legislación Consolidada. Jefatura del Estado. BOE núm. 164, de 10 de julio de 2015. Referencia: BOE-A-2015-7731
  4. Sanz-Cobena, A., Lassaletta, L., Garnier, J., & Smith, P. (2017). Mitigation and quantification of greenhouse gas emissions in Mediterranean cropping systems.
  5. Pérez-Miñana, E. 2016. EU-CAP effect on the Navarra environment.
  6. Spain – Open Data Maturity. European Data Portal overview,  2016.


ANDALUCIA, El sector agrícola contribuye a reducir las emisiones de los GEI reciclando?

El sector agrícola de Andalucia recicla?

Afortunadamente, la respuesta es SI. El sector está más comprometido que nunca con la correcta gestión de los residuos que genera (Caldeiro Jiménez, 2016). El Sistema…

Source: ANDALUCÍA, ¿AYUDANDO A CONTROLAR LAS EMISIONES DE GEI RECICLANDO EL PLÁSTICO?

Mejorando el discurso asociado a la aplicación de las recomendaciones expuestas en los informes del IPCC

En las ponencias que tuve la oportunidad de escuchar en el transcurso del IV workshop de REMEDIA, me quedé con la grata impresión de que el sector agrícola ha progresado enormemente en todas las op…

Source: Mejorando el discurso asociado a la aplicación de las recomendaciones expuestas en los informes del IPCC

EU-CAP effect on the Navarra environment

granja-ovejas-valle-baztan-navarra

Summary

Approximately 38% of the EU budget (equivalent to 0.4% of the Union’s GDP) is spent on agriculture and rural development mainly through the Common Agricultural Policy (CAP) (EU agriculture spending report, 2015). Furthermore, in the EU, the agricultural area covers slightly less than half of the territory; therefore CAP is a policy that can have a major impact on the environment. In the province of Navarra (North-East of Spain), the Agriculture sector makes a significant contribution to the region´s economy.  Given the huge difference in the distribution of these subsidies across the sector, it would be interesting to assess whether a similar type of difference is evident in the environmental health of the farming practices they follow.

This project explores the relations between the amount of subsidies granted to the Agriculture sector of the Spanish province of Navarra during 2015 and the beneficiaries’ environmental practices, as evidenced by the region’s environmental datasets available at the Navarra’s government website.

The analysis has demonstrated the existence of relations amongst the environmental, agriculture and economic indicators covered, particularly between levels of risk erosion, crop yield and CAP subsidies.

Overall, subsidies in the region of Navarra seem to be working, as the relation between the environmental indicators covered and the subsidies seem to follow expected trends, i.e. those perceiving higher subsidies are:

    • working the land using practices causing lower levels of risk erosion,
    • working in areas with habitats showing sustainable levels of biodiversity,
    • less prone to use irrigation farming although this is not difficult given the levels of precipitation on the region.

The results are encouraging but there was missing information, such as the consumption of fertilisers in the region, which ought to be incorporated to the study because the results currently generated require further processing to be more reliable.

Another opportunity for improvement would be by working directly with the records available in the SIGPAC system, the GIS managed by the Spanish government. As it holds the records of all the farms supported by CAP funds, it would enable more accurate computations. Currently this data is only available to view which makes it difficult to include in external workflows.

Data Sources: the records of all the Navarra CAP beneficiaries were downloaded from the “Spanish Agrarian Funding Guarantor” (FEGA is the Spanish acronym). The environmental indicators included in the study are:

    • The level of risk erosion by water as estimated by the European Soil Data Centre
    • The vulnerability of the Natural habitats identified in the region. The layer includes a qualitative indicator describing the “health” of the habitat in terms of the biodiversity level identified.
    • The distribution of the landscape (the status of the mountainous areas). This was complemented by an elevation data model extracted from the European data portal.
    • The status of the Nitrate Vulnerable Zones identified in the region.

The agriculture indicators covered are:

    • Navarra’s cereal crop production. As cereals are the main crops grown in the region, the study did not include any other.
    • The type of farming, which could be: rain-fed, irrigation.
    • The distribution of the pasture lands. The dataset included two relevant factors: the distribution of livestock units (LSU) across the pasture lands, the area of land.

The website of the Government of Navarra was the main source of information. It provided both environmental and agricultural datasets. In the previous list unless otherwise stated, the indicator was obtained from the Government of Navarra.

nv_context

As there is a reasonable mixture of both, geographic and socio-economic data, the analysis was performed in three phases, using both ArcGIS and Excel. Furthermore, as most of the input layers use the GCS “ETRS89 / UTM zone 30N”, all the processing was done using this coordinate system.

Data Processing

table_subcomagr

table2_cap_env

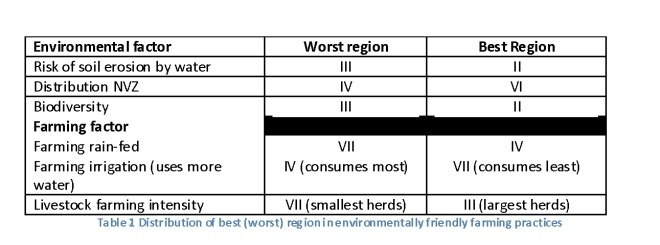
Initially, numeric data was extracted from the geographic datasets using ArcGIS tools: attribute table operators (for shapefiles) and Zonal statistics (for raster files). This output was then integrated with the economic data in Excel and an initial set of conclusions were drawn regarding the relations between environmental indicators, agricultural and economic factors for the different agricultural regions in Navarra (Tables 1,2).

The results estimated in this first step are summarised in Table 2. For each Environmental factor considered (column 1), the worst behaved (column 2) and best behaved regions (column 1) have been identified.  The results suggest that the behaviour varies across the regions. It also indicates that overall farming practices in region III seem to be the ones requiring the most improvement. On the other hand, the CAP beneficiaries in region II seem to be the most environmentally inclined.

Regions I, V, VII are not registered at all which although is good from the perspective of “worst performance”, also seems to suggest the need for further improvement.

In order to perform the spatial analysis (main aim of the study)), it was necessary to update the records in ArcGIS, adding the subsidies data in Excel to the data stored as geographic datasets.

  1. The economic data was integrated with the geographic layer holding details of the different Navarra agricultural regions (shapefile).
  2. The environmental factors were available both as raster and shapefiles therefore the integration worked in a slight different manner in each case.
  3. All the layers (shapefiles) holding agricultural information were integrated using a combination of Spatial Join operations. The same procedure (Spatial Join) was used to integrate all the layers (shapefiles) holding records of environmental factors.
  4. The data in the raster files was added using the Zonal statistics tool.
  5. In a final step, it was necessary to integrate the Environmental layer and the Agricultural layer resulting from the previous steps into one layer holding all the records. The resulting dataset includes all the economic, environmental and agriculture data collected. This dataset is used in the subsequent steps to assess the relations between all the indicators using a spatial analysis method.
  6. The spatial analysis uses two ArcGIS tools: Exploratory Regression (ExpRegr) and Ordinary Least Squares (OLS). Both require the specification of a dependent variable and a set of explanatory variables. In this study, the dependent variable was the SUBSIDIES granted through the EU CAP scheme. The explanatory variables correspond to all the environmental and agricultural factors described earlier.
  7. The Exploratory Regression tool was used to determine the best combination of explanatory variables which should be used to specify an OLS model for predicting the “dependent variable” (SUBSIDIES).
  8. The best set of explanatory variables identified in the previous step was fed to OLS. This tool performs global Ordinary Least Squares (OLS) linear regression and enabled the modelling of the dependent variable (SUBSIDIES) in terms of its relationships to the set of explanatory variables, providing a fairly good idea of the existing dependencies between them.

Results

The best set of environmental and agricultural indicators to model CAP subsidies in Navarra, that were identified using the Exploratory Regression tool are:

Risk Erosion (MEANRISKER, units: tonnes*ha-1*yr-1)
Elevation (MEANDEM, units: meters)
Mountainous indicator (CZONA_ZM, qualitative: Alta Montana, Desfavorecida, Montana, Normal)
Habitat vulnerability (VGLOBNUM, qualitative indicator:1 – 12)
Yield Cereal (rain-fed) (TOTPRODCERSEC, total tonnes)
Pasture lands indicator (CCAT_NUM, qualitative indicator: heads LSU)
NVZ vulnerability (VULNER_NUM, qualitative indicator: Nula, Baja, Media, Alta)

olsresults

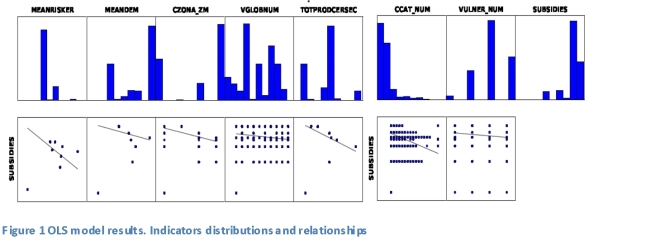
A book of maps, one page for each element included in the model, is available. The book includes distribution of CAP subsidies through Navarra,  distribution of LSU through Navarra’s pasture lands, crop yield, risk of erosion, elevation, distribution of mountainous regions, natural habitats biodiversity level, and a vulnerability level of the NVZ areas. It also includes a scatterplot of SUBSIDIES against  each of the indicators in the model (Figure 1).

ols_table_output

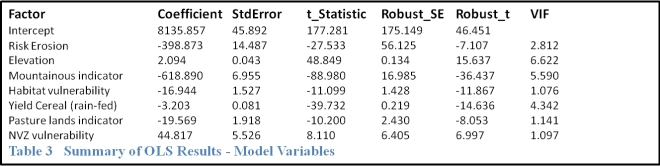
The OLS model estimated by the tool is shown in Table 3. The results show they are all significant. Nevertheless, of the model indicators there are two (Koenker (BP) statistic, Jarque-Bera Statistic) which are statistically significant (p < 0.01) showing it is likely the relationships modelled are not consistent and there is evidence of model bias.

Common sources of model bias include: non-linear relationships, data outliers. The OLS scatter plot matrix (Figure 1) shows evidence of both in the model developed. The analysis has demonstrated the model is probably missing key explanatory variables. It has also indicated the existence of relations amongst all the indicators covered, particularly between level of risk erosion, crop yield and CAP subsidies.

Overall CAP subsidies, at least in the region of Navarra, seem to be working, as the relation between each of the indicators covered and the subsidies are following expected trends, i.e. those perceiving higher subsidies are:

    • working the land using practices causing lower levels of risk erosion,
    • working in areas with habitats showing sustainable levels of biodiversity,
    • less prone to use irrigation farming although this is not difficult given the levels of precipitation in this part of the world.

The only concern is associated to the management of NVZ. The current results appear to indicate higher subsidies linked to higher levels of vulnerability. Nevertheless, the lack of information on the use of fertilizers in the region, complicate the task of concluding anything further in this regard.

The Navarra local authorities do include a wealth of information which was very useful for the purposes of this  study. Nevertheless, an estimation of the GHG emissions was not possible because:

      • the information on livestock was not sufficiently detailed,
      • nor was the energy consumption or the use of fertilizers.

The distribution and vulnerability of NVZ across the regions was used instead. The analysis can be improved with  more appropriate data on livestock and use of fertilizers.

The results suggest that the highest beneficiaries from CAP subsidies might not follow the expected environmental practices.